Perceptually Important Points
What are perceptually important points and how Level2 uses it
Imagine you're trying to describe a squiggly line you drew on a piece of paper to someone over the phone. Instead of telling them every tiny detail of every turn and curve, you'd probably focus on the key moments or "points" where the line changes direction significantly. These key moments or points are what we'd call PIPs.
Simplification: Just like summarizing a long story with its main plot points, PIPs summarize data by focusing on the points that matter most for understanding the overall picture or pattern.
Visibility: These points are "perceptually important" because they're what your eyes and brain naturally notice first when looking at data. They're the peaks, troughs, or sharp turns that give the data its character.
Efficiency: By using PIPs, you can reduce a lot of data down to just a handful of points, making it easier to analyze, visualize, or communicate without losing the essence of what the data is showing.
Application: In practical terms, this could be used in various fields like finance (to highlight market trends with fewer data points), medicine (to track changes in health metrics over time), or even in daily life (to describe a road trip with key stops rather than every mile).
So, PIPs are about capturing the essence of data in a way that's both manageable and meaningful, focusing on what's most noticeable and relevant to understanding the data's story.

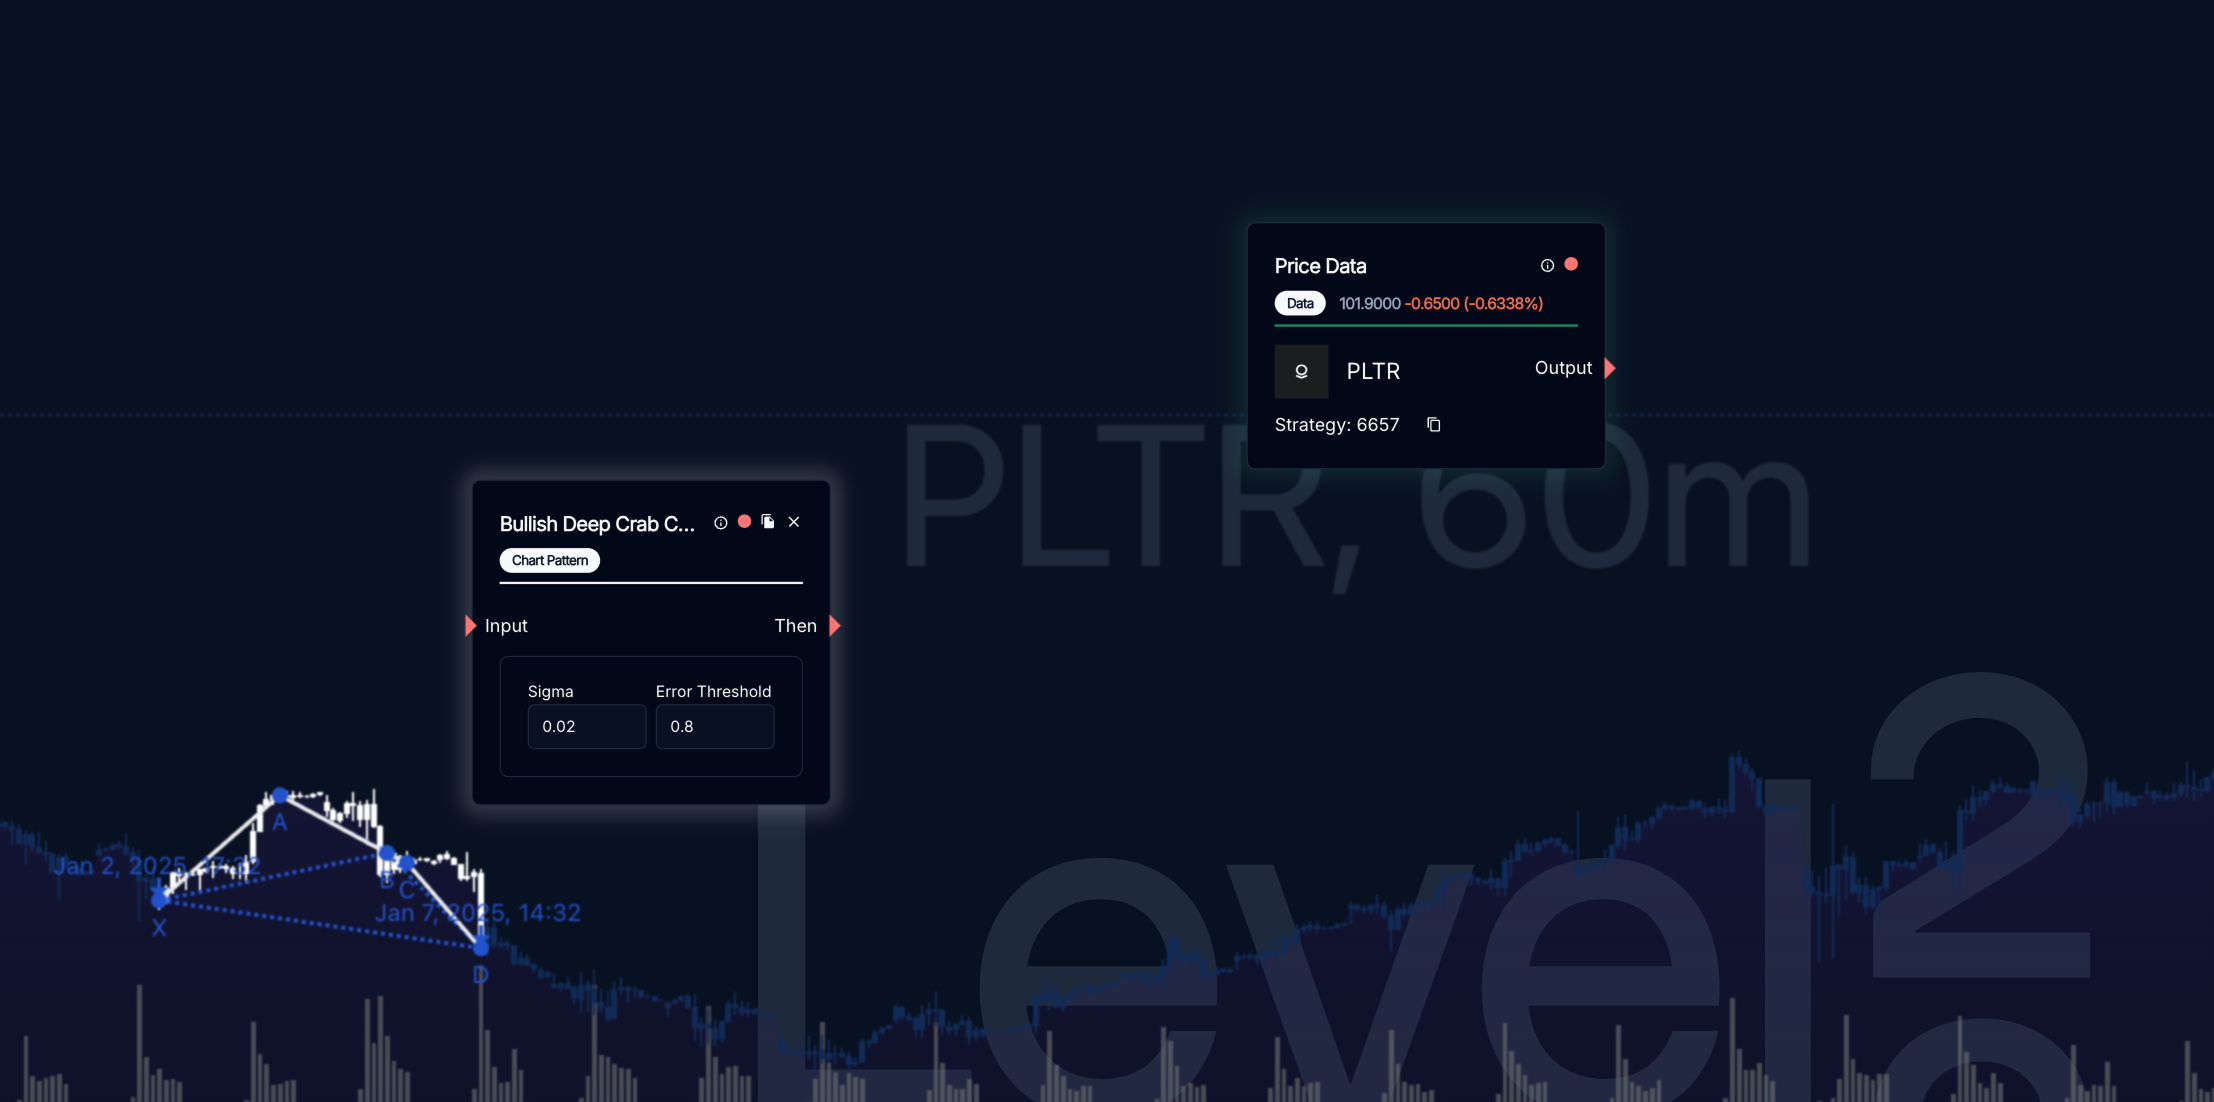
Level2 leverages Perceptually Important Points fundamentals and uses the quant algorithm to find patterns on historical data sets. Users can now algorithmically backtest chart patterns that previously wasn't possible.